Full test scenario
Steps for running a Performance Test Chaplin
Every time someone want to execute a test scenario on Chaplin they make a request with JMeter and with JMeter in combination with dotTrace.
Prerequisites
Visual Studio with the latest version of Chaplin and Versla.
JMeter installed.
DotTrace installed.
The database instance installed where you want to test Chaplin on.
Step-by-step Guide
Open visual studio with the correct code base Marvelous.Versla.Server.
Start Raven.Server.exe.
If you type
openbrowser. A new tab in your browser will open. Which makes it easier to view the data.
Open JMeter.
If you already have the JMeter plugin manager with the plug-ins: 3 basic graphs, Command-line Graph Plotting Tool, Custom Thread Groups and Graphs Generator Listener. You can skip to step 8.
Download and install the JMeter plugin manager: Documentation :: JMeter-Plugins.org.
Re-start JMeter.
Install the following plug-ins with the manager:
3 Basic Graph,
Command-Line Graph Plotting Tool;
Custom Thread Groups;
Graphs Generator Listener.
Download the JMeter script from Basecamp: Chaplin_50Request_in_5_seconds.jmx (basecamp.com).
Open the test script in JMeter.
Start the Versla server without debugging!
The shortcut for running without debugger in Windows is: ctrl+f5.
Make sure the database is empty.
Run the test in JMeter.
For running the test, click the green button;
Now, check the results of the test;
Go to view results in table.
If you only wanted JMeter results: save the results. You can screenshot and analyze them. If you needed to test multiple scenarios go back to step 7. If you wanted to test run a new test on a new instance stop te server and go back to step 6.
Attaching dotTrace
Clear the results in JMeter.
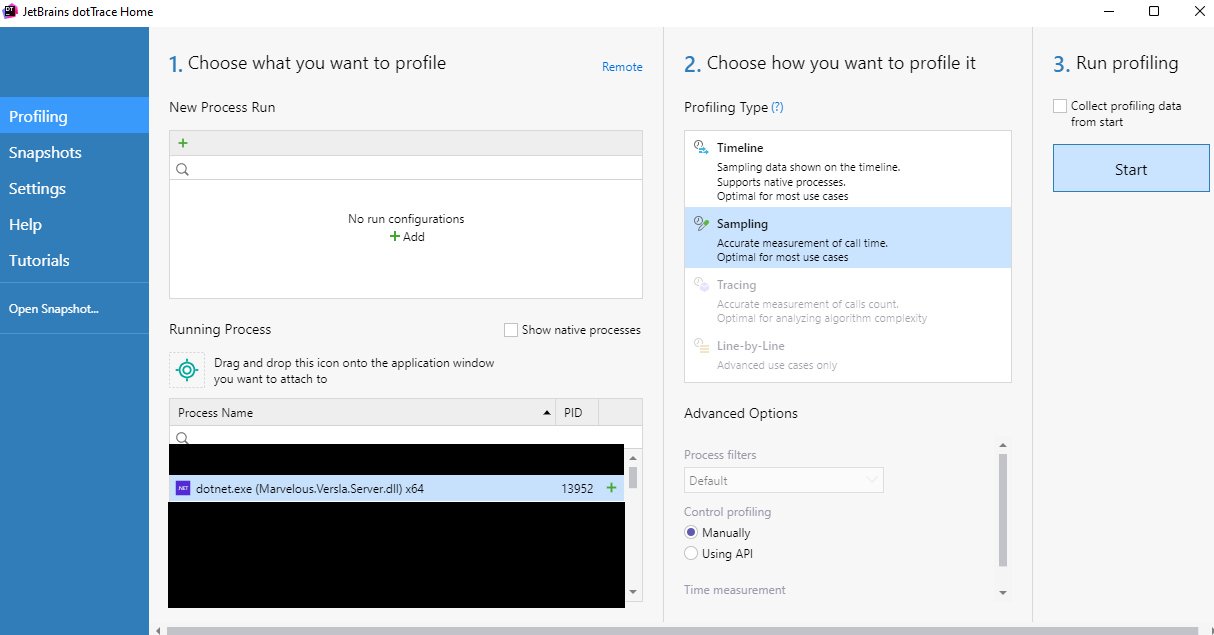
Open dotTrace.
If you want to start a new server instance you should do it now.
Attach dotTrace.
Select the Marvelous.Versla.Server instance.
If the server isn't visible press show processes of al users
Select Sampling.
Make sure the collection data from start is turned off.
Press start when ready.

Press the start button to start profiling.
You should see a black arrow on the screen.
Make a request or run a test scenario.
As soon as the request is finished you can press: Get Snapshot and Wait.
Basecamp already has a document on how to profile snapshots, which you can find here: Analyze_sampling_snapshot.pdf (basecamp.com)
When seriously testing features in JMeter and dotTrace try using the following scenarios. You should use the newest test scenario.
Each test will be executed two times in the same instance, because the first call is slower than all the other tests on the same instance. In: School sprint 4 JMeter tests.pdf (basecamp.com) there is an example of how I documented my test results.