DotTrace
With dotTrace it is possible to profile the code. For the official documentation go to: dotTrace documentation.
Steps for Testing with dotTrace
Prerequisites
Visual Studio with the latest version of Chaplin and Versla.
DotTrace installed.
The database instance installed where you want to test Chaplin on.
Step-by-step Guide
Open visual studio with the correct code base Marvelous.Versla.Server.
Start Raven.Server.exe.
If you type
openbrowser. A new tab in your browser will open. Which makes it easier to view the data.
Start the Versla server without debugging!
The shortcut for running without debugger in Windows is: ctrl+f5.
Make sure the database is empty.
Open dotTrace.
If you want to start a new server instance you should do it now.
Attach dotTrace.
Select the Marvelous.Versla.Server instance.
If the server isn't visible press show processes of al users
Select Sampling.
Make sure the collection data from start is turned off.
Press start when ready.
![DotTrace attach versla server][1]
Press the start button to start profiling.
You should see a black arrow on the screen.
Make a request or run a test scenario.
As soon as the request is finished you can press: Get Snapshot and Wait.
Basecamp already has a document on how to profile snapshots, which you can find here: Analyze_sampling_snapshot.pdf (basecamp.com)
How to Analyze Sampling Snapshots in dotTrace
There are different views you can use to analyze application performance. The snapshot used in this analyzation is from a sampling profiling session.
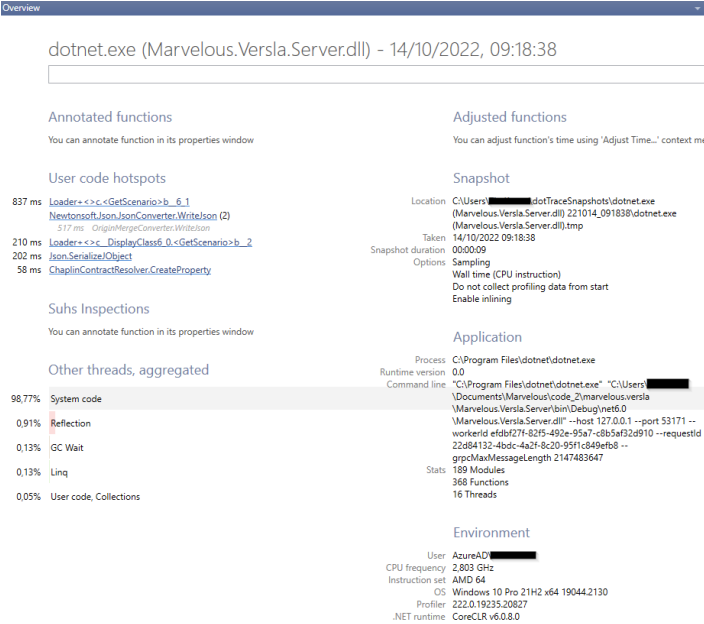
The first view is the Overview. This view gives some general information about a snapshot. Is an Overview of a profiling session that ran on Chaplin. The overview consists of the following sections:
Annotated Functions: contains the list of functions annotations you have added.
Adjusted Functions: contains the list of functions annotations you have added.
User code hotspots: displays the list of top hotspots from the user code subsystem.
Snapshot: contains information about snapshot location, creation date and time, profiling settings.
Application: contains information about profiled application, which varies depending on the selected application type; the total number of functions and modules in the current snapshot.
Environment: lists system information about the computer where the application was profiled.
Other Threads: displays combined time distribution between subsystems for all other threads.

The second and third views are your trees. You can start investigation with the Threads Tree view to see the full picture and understand which functions in which threads are executed and how many threads are spawned by your application. The Call Tree does the same but without the division into threads.
The Thread Tree view serves many purposes. Typical use cases include the following:
View what kind of threads are being spawned by your application.
Monitor all threads and their activities.
Analyze each tread’s activity.
Find and examine critical execution paths.
The Thread Tree lists all threads in your application. They are sorted by their execution time. Each thread is identified by its name or ID. You can expand a thread node and search the call stack for expensive functions. The appearance of this view depends on the current filter settings.

The Call Tree view is a representation of all function calls in all threads. Each top-level node represents a top-level function which was executed by a certain tread. This view lets you know:
Quickly get down to actual application activity.
Look through the execution path of the process or a function.
Find and examine critical paths.
For each function call, view the percentage relative to total running time of all threads.

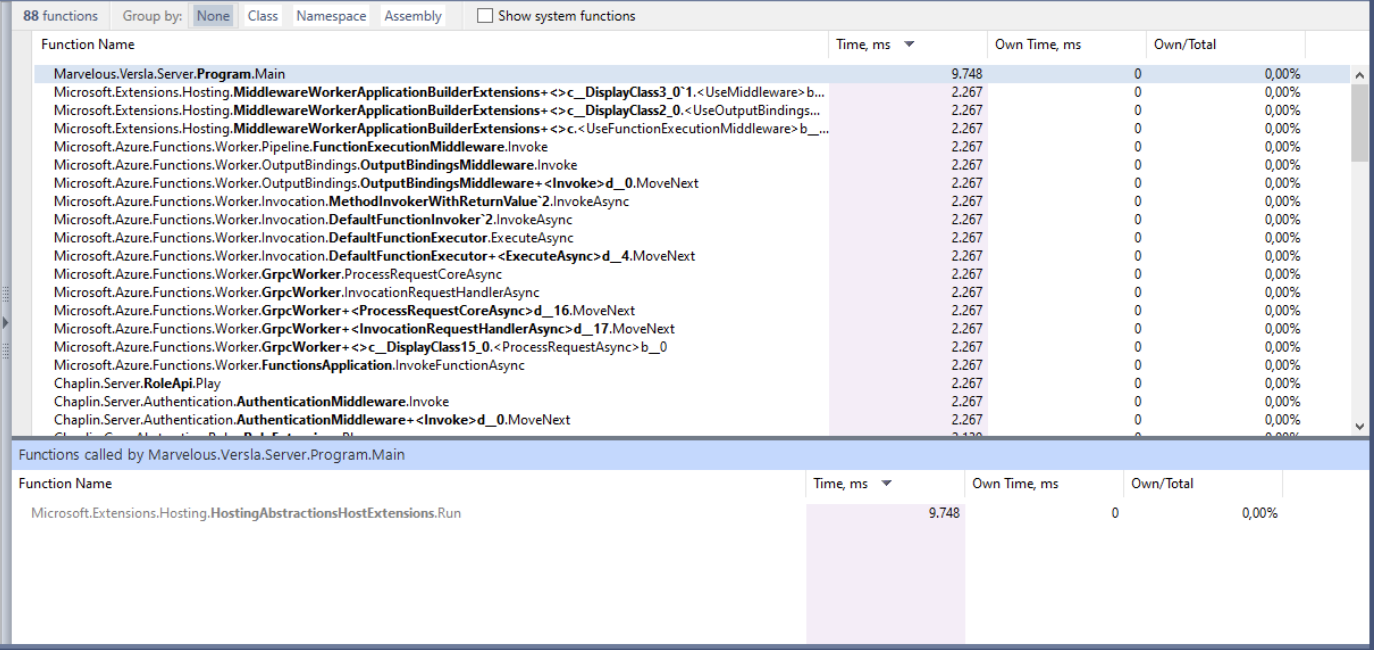
The Plain list helps you not only review snapshot data, but also rearrange it in different ways. By default, you get a list of all functions sorted by total execution time. Using tis view you can study how much time is spent in the function itself, how many times the current function is called.
The view consists of two lists. The first one contains all functions from the call stack. The second lists shows functions called by the function selected in the first list. When you open a snapshot in the Plain List view, you can:
Look through the list of all functions called in your application during the profiling process.
Sort functions by Function Name, Time and Own Time. To do that, click the corresponding column name. By default, functions are sorted by time. That lets you quickly find functions that take the most time.
Group functions in different ways. You can group by class, namespace or assembly. That helps you focus on functions from a certain part of your application.
Choose whether to show or hide system functions.
Collapse or extend callees for a particular function, i.e. show all call stacks starting with the selected function. This gives a summary of function execution.

If you want to focus on the most time-consuming functions, it’s better to use the Hot Spots view. It represents a list of callback trees for each of 100 functions with the highest own time. The Hot Spots view lists functions with highest execution time in the profiled application code. The call execution time is calculated as a sum of own method’s time an times of all system methods it calls.
